


The highest possible DAT score is 600 on the 200 to 600 scale the ADA introduced on March 1, 2025, and 30 on the 1 to 30 scale it replaced. Nobody reached it in 2025: across the 17,399 Academic Averages the ADA reported for March through December of that year, zero were a 600 and zero were a 590.
That gap between the ceiling and the scores people actually earn is the useful part of this question. The ADA's own percentile table puts an Academic Average of 540 at the 100th percentile, sixty points below the top of the scale. Every point above 540 is real, measurable work that moves your percentile rank by nothing at all.
- The maximum DAT score is 600 per reporting area on the current scale, in 10-point steps from 200. The old maximum was 30.
- The ADA's percentile table reaches the 100th percentile at an Academic Average of 540, not at 600.
- Of 17,399 exams from March 1 to December 31, 2025, three earned an Academic Average of 580 and none earned 590 or 600.
- A perfect section score is far from impossible: 180 exams scored 600 in Organic Chemistry and 155 in Biology.
- One 10-point step is worth 8 percentile points at 400 and zero at 540, so the chase to the ceiling buys nothing.
The scale runs 200 to 600, and the old one topped out at 30
The ADA replaced the DAT's 1 to 30 reporting scale with a three-digit scale on March 1, 2025. Under the scoring change notice, scores run from 200 to 600 in 10-point increments, so 600 is the maximum and there are 41 possible scores in each reporting area.
Every score now sent to ADEA AADSAS appears on the new scale, including results from before March 2025, which the ADA converts psychometrically. So a 30 earned in 2023 does not stay a 30 on an application filed today.
The conversion is not uniform across reporting areas. Table 1 of the ADA's score reporting scale guide maps an old 30 to a 600 Academic Average, but to a 590 in Organic Chemistry and a 580 in Reading Comprehension. A perfect score on the old scale does not always convert to a perfect score on the new one. If you are holding an older report, our DAT score converter does the per-section lookup, and the DAT scoring guide explains how the scale is built.
Nobody earned a 600 Academic Average in 2025
The ADA publishes the full score distribution each year in the DAT User's Manual. For exams taken between March 1 and December 31, 2025, the top of the Academic Average distribution looks like this.
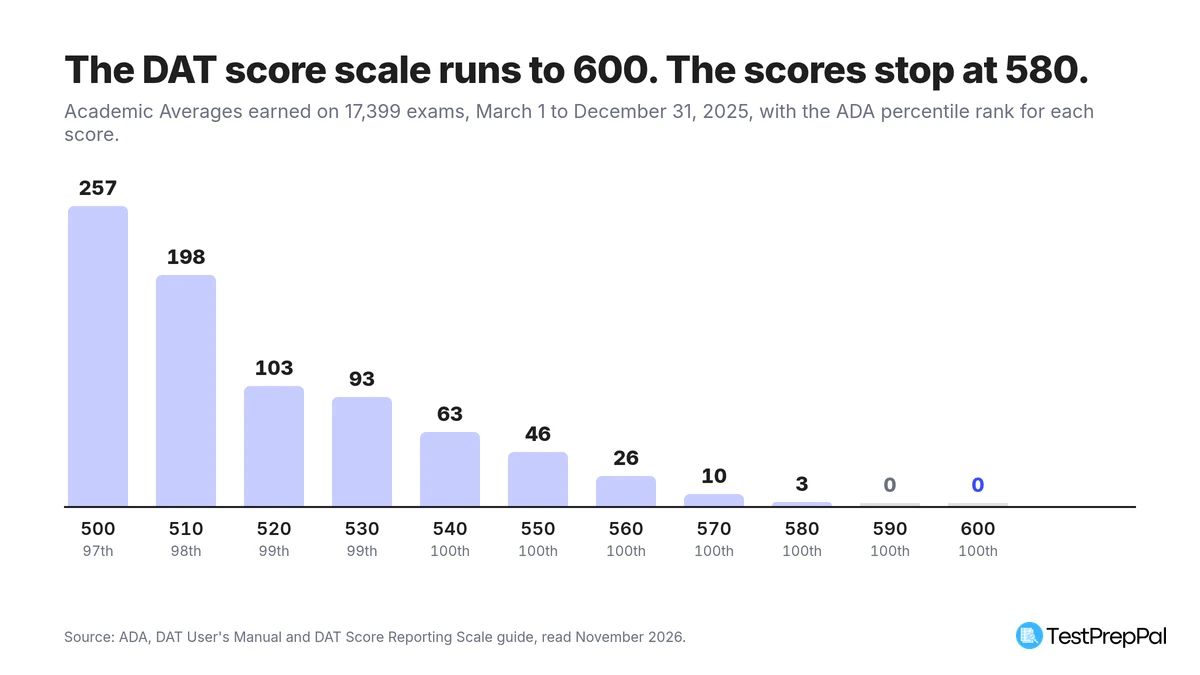 Academic Averages earned on 17,399 exams, March 1 to December 31, 2025. Source: ADA DAT User's Manual.
| Academic Average | Exams | Exams at this score or higher |
|---|---|---|
| 500 | 257 | 799 |
| 510 | 198 | 542 |
| 520 | 103 | 344 |
| 530 | 93 | 241 |
| 540 | 63 | 148 |
| 550 | 46 | 85 |
| 560 | 26 | 39 |
| 570 | 10 | 13 |
| 580 | 3 | 3 |
| 590 | 0 | 0 |
| 600 | 0 | 0 |
The highest Academic Average anyone actually earned in those ten months was 580, and three exams got there. That is 0.017% of the pool. Reaching 540, the lowest score the ADA's table calls the 100th percentile, took 148 exams out of 17,399, or 0.85%.
This is why the "perfect DAT score" stories you will find are worth reading carefully. Most of them describe a perfect 30 on the old scale, which was a different test score on a different distribution, and almost all of them mean a single section rather than the composite.
A perfect section score is a different achievement
The Academic Average is not a test you sit. The User's Manual defines it as the rounded arithmetic mean of five scores: Quantitative Reasoning, Reading Comprehension, Biology, General Chemistry and Organic Chemistry. Perceptual Ability is scored and reported separately and does not enter the Academic Average at all, which is covered in our guide to what the Perceptual Ability Test asks.
Rounding is to the nearest 10. So a 600 Academic Average needs those five section scores to average 595 or more. One 560 in the set and the ceiling is gone.
Single sections tell a completely different story.
| Reporting area | Exams scoring 600 | Share of exams |
|---|---|---|
| Organic Chemistry | 180 | 1.0% |
| Biology | 155 | 0.9% |
| General Chemistry | 86 | 0.5% |
| Perceptual Ability | 85 | 0.5% |
| Quantitative Reasoning | 65 | 0.4% |
| Reading Comprehension | 19 | 0.1% |
| Survey of the Natural Sciences | 3 | 0.0% |
| Academic Average | 0 | 0.0% |
Across the six individually scored areas, 590 perfect scores were recorded in those ten months. Across the two composites, three. A 600 in Organic Chemistry happened roughly once in every 100 exams. A 600 Academic Average happened never.
The pattern follows directly from the arithmetic. Survey of the Natural Sciences is the rounded mean of three science scores, so it is already hard to max, and the Academic Average averages five. Each section you add is another chance for the mean to fall below 595. Our DAT score calculator shows the same effect at any score level: one weak section sets the composite.
What the last sixty points are actually worth
Table 2 of the reporting scale guide gives the percentile rank for every score, built on a normative sample of more than 30,000 attempts over a recent two-year period. A percentile rank there is the share of that sample scoring at or below the number.
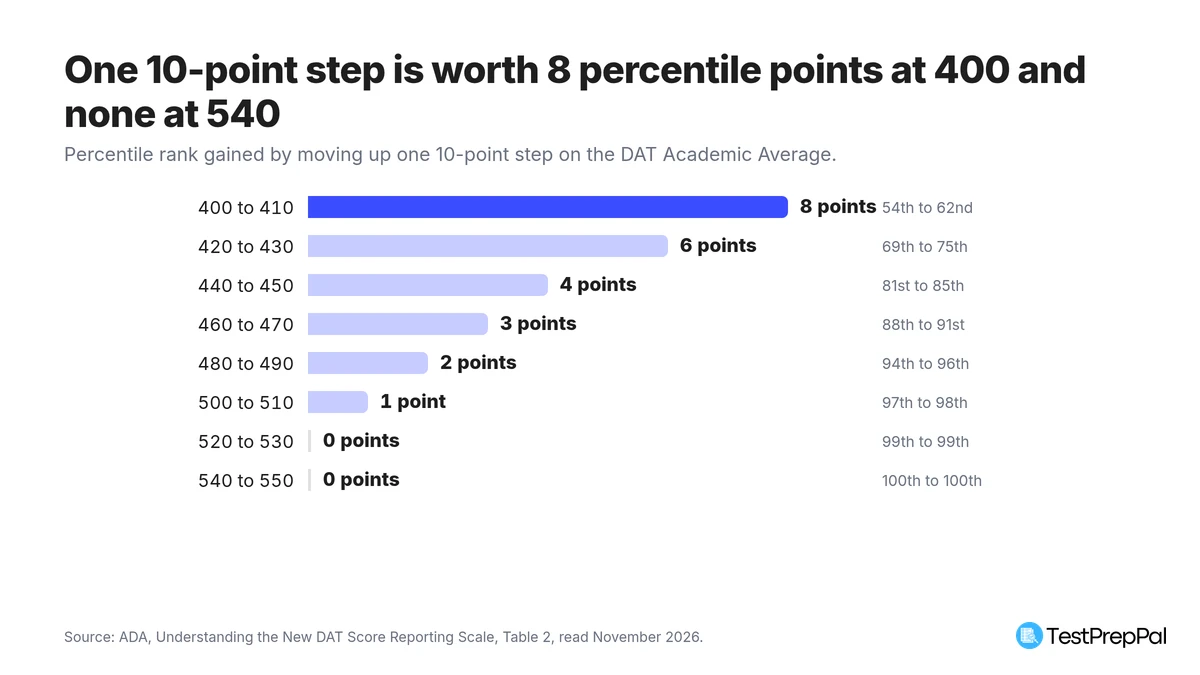 What a single 10-point step adds to your Academic Average percentile. Source: ADA score reporting scale guide, Table 2.
| Academic Average | Percentile rank | Gain from 10 points lower |
|---|---|---|
| 400 | 54th | |
| 410 | 62nd | 8 |
| 440 | 81st | 6 |
| 470 | 91st | 3 |
| 500 | 97th | 1 |
| 520 | 99th | 1 |
| 540 | 100th | 1 |
| 560 | 100th | 0 |
| 580 | 100th | 0 |
| 600 | 100th | 0 |
Four 10-point steps from 400 to 440 move you from the 54th percentile to the 81st, a gain of 27 points. The six steps from 540 to 600 move you from the 100th percentile to the 100th percentile. Same effort, measured in scale points. Nothing to show for it.
That is the honest answer to "how high can I get". The scale has a ceiling at 600, but the percentile scale runs out at 540, and the reported pool runs out at 580. Anything above 540 is invisible to the only comparison admissions readers have.
It also explains why the AI answers calling 600 "the 100th percentile" are technically right and practically useless. So is 590, 570, 550 and 540.
The score to aim at instead
The useful target sits far below the ceiling, in the part of the range where 10 points still move something.
For context on the middle of the distribution, the 2025 mean Academic Average was 407.8 and first-time takers averaged 413.9 against 396.3 for repeaters. Our average DAT score page breaks that window down by reporting area.
Against those numbers, here is what the top bands cost in rarity:
- 440 puts you at the 81st percentile. About 28.8% of 2025 exams reached it.
- 470 is the 91st percentile, reached by 12.7%.
- 500 is the 97th percentile, reached by 4.6%.
- 540 is the 100th percentile, reached by 0.85%.
The step from 440 to 470 costs three 10-point moves and buys 10 percentile points. The step from 500 to 540 costs four and buys 3. Somewhere between 470 and 500, extra DAT points stop being the cheapest thing you can improve in an application.
The ADA's own validity data supports stopping there. In its 2022 to 2024 meta-analysis, the Academic Average had a corrected correlation of 0.60 with first-year preclinical biomedical science grades, the strongest of any DAT score. A correlation that size describes a useful signal, not a precise ranking, and it does not get more precise at the top of the scale where the ADA itself stops distinguishing between scores.
The one threshold the ADA works through in its own guidance is a program that historically required an Academic Average of 18, which it says should now require 390. That is 150 points below the ceiling. For a school-by-school view, the dental school acceptance calculator weighs a score against a list and a GPA, the DAT percentile calculator gives the rank for any score, and what counts as a good DAT score sets the bands out in full. If one science section is what is holding your average down, a targeted DAT prep course is a better use of the time than a general second pass, and the section breakdown covers what each one tests. Everything else about the exam starts at our DAT hub.
Highest DAT score FAQs
Has anyone ever gotten a 600 on the DAT?
In a single section, yes, and often. Of the 17,399 exams reported between March 1 and December 31, 2025, 180 scored 600 in Organic Chemistry and 155 in Biology. On the Academic Average, no exam in that window scored 590 or 600, and only three reached 580. The composite is the rounded mean of five section scores, so it takes near-perfect performance in all five at once.
Is a 30 on the old DAT the same as a 600?
For the Academic Average, yes: the ADA's concordance table maps an old 30 to a 600. It is not the same in every area. An old 30 in Organic Chemistry converts to 590, and in Reading Comprehension to 580. Old-scale scores are converted automatically when they are sent to ADEA AADSAS.
What is a 450 on the DAT?
A 450 Academic Average is the 85th percentile on the ADA's percentile table. About 22% of Academic Averages from March to December 2025 were 450 or higher. It is a solid, above-average score that is still 90 points below the top of the scale and 15 percentile points below where the table stops distinguishing.
What is a 500 on the new scale in old DAT terms?
It falls between an old 24 and an old 25, which convert to 490 and 510 respectively. A 500 Academic Average is the 97th percentile, and 4.6% of 2025 exams reached it.
Can I get into dental school with a 17 DAT score?
An old-scale 17 Academic Average converts to 370 on the current scale, which is the 32nd percentile. The ADA publishes no minimum and each program sets its own, but the only worked example the ADA gives is a program moving a long-standing cutoff of 18 to its new-scale equivalent of 390. A 370 sits below that line, so the realistic path is a retake with a specific weak section to fix, not a general second attempt.
We may earn commissions from some links on this page, but this does not affect our reviews or your experience.