

DAT Score Conversion Tool
Convert old DAT scores (1-30) and new DAT scores (200-600) using ADA concordance values.
Conversion direction
New score (200-600)
Quick AA lookups: 400 / 430 / 440 / 450 DAT score
Conversion is approximate by design. ADA concordance supports meaningful comparison across scales, not exact one-to-one replacement for every context.
DAT scores have been reported on a 200 to 600 scale since March 1, 2025, in 10-point steps. On the Academic Average, the ADA concordance table puts an old 18 at 390, an old 20 at 420 and an old 22 at 460, and the chart below carries every 3-digit score from 390 to 500 with the old score it matches.
This tool handles both directions:
- Old DAT score (1-30) -> New DAT score (200-600)
- New DAT score (200-600) -> Approximate old DAT score (1-30)

DAT score conversion chart
The logic in this tool is the ADA concordance table published with the DAT scoring update. If you landed here wanting the scale itself rather than a conversion, start with how DAT scoring works.
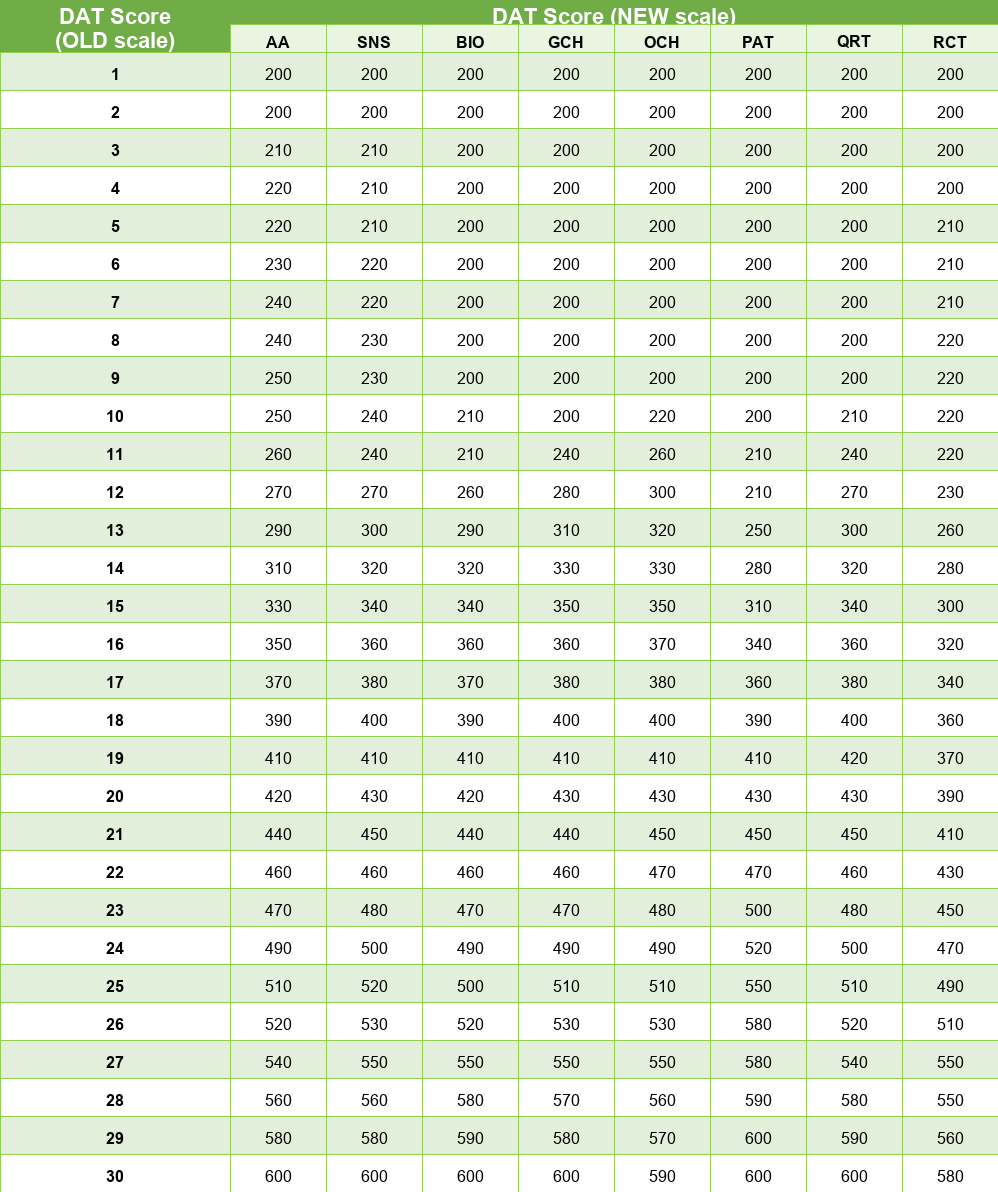
- Chart and official source: DAT score reporting scale and concordance (ADA PDF)
- Scoring change overview: ADA DAT scoring update
New score to old score, Academic Average
The ADA publishes the concordance in one direction only, old to new. Reverse it and a detail shows up that most conversion pages skip. In the 390 to 500 range, only seven Academic Average values are actual concordance points. The other five sit between two old scores, and a page that hands you one old number for them has rounded on your behalf.
The percentile column is the Academic Average column of Table 2 in the same ADA document, which gives the share of candidates scoring at or below each 3-digit score.
| New AA score | Old-scale equivalent | AA percentile rank |
|---|---|---|
| 390 | 18 | 47 |
| 400 | between 18 and 19 | 54 |
| 410 | 19 | 62 |
| 420 | 20 | 69 |
| 430 | between 20 and 21 | 75 |
| 440 | 21 | 81 |
| 450 | between 21 and 22 | 85 |
| 460 | 22 | 88 |
| 470 | 23 | 91 |
| 480 | between 23 and 24 | 94 |
| 490 | 24 | 96 |
| 500 | between 24 and 25 | 97 |
Section conversions are not identical to the Academic Average, so use the score-type selector in the tool rather than reading this table for Biology or Reading Comprehension. An old 18 is a 390 Academic Average but a 360 in Reading Comprehension. To turn a 3-digit score into a percentile for a section rather than the AA, use the DAT percentile calculator.
New DAT score conversion (200-600)
Beginning March 1, 2025, DAT scores are reported on a 200-600 scale in 10-point increments, so 200, 210, 220 and so on up to 600. There are 41 possible scores on the scale and nothing between the steps.
Both formats stay valid. The ADA says 2-digit and 3-digit scores are both valid scores, and it converted results from administrations before March 1, 2025 so that ADEA AADSAS could show every applicant on the 3-digit scale. Your original 2-digit report is still in the DTS Hub if you want to see it.
If you have older references in the 1-30 format, use this tool to convert them to the new reporting system for cleaner comparisons with current admissions benchmarks.
420 DAT to old score (and 390 through 500)
For Academic Average (AA), the exact concordance points in the common range are:
- 390 DAT -> old 18
- 410 DAT -> old 19
- 420 DAT -> old 20
- 440 DAT -> old 21
- 460 DAT -> old 22
- 470 DAT -> old 23
- 490 DAT -> old 24
The five values in between are the ones people most often get wrong. 400 sits between an old 18 and an old 19, 430 between an old 20 and an old 21, 450 between an old 21 and an old 22, 480 between an old 23 and an old 24, and 500 between an old 24 and an old 25. The tool resolves those to the nearest concordance point, which is the lower one in all five cases because each gap is even.
Use the score-type selector in the tool because section conversions are not identical to AA.
What a 400, 430, 450 or 480 DAT score means
These values get searched because applicants are trying to map older admissions advice onto a current score report. The percentile is usually the more useful half of the answer: a 400 Academic Average is the 54th percentile, a 430 is the 75th, a 450 is the 85th and a 480 is the 94th.
For what those percentiles mean for an application, see what counts as a good DAT score. If you want to estimate scaled scores from raw correct answers on a practice test, use the DAT score calculator. Converting a national figure rather than your own score? The average DAT score page runs every 2025 reporting-area mean through this same concordance. Everything else about the exam starts at our DAT hub.
When to use this tool
- You took the DAT before the scale change and need new-scale context.
- You have a new score and want to understand how it compares to old-school references.
- A school page, advisor note or forum post still quotes a 1-30 requirement and you need to know what it asks for on the current scale.
- You are comparing your own two attempts, one scored under each system.
DAT score conversion limitations
- Concordance is designed for approximate comparability, not a perfect one-to-one replacement. The ADA built the table from more than 30,000 attempts over a recent two-year period, pairing scores that occupy similar relative positions in each distribution.
- A single converted value can map to a range in reverse conversion, and fifteen of the 41 points on the new scale have no Academic Average row at all.
- Section-level relationships differ from AA, so always choose the correct score type.
- Percentile ranks come from one national normative sample and shift as testing populations change. Check the ADA table before quoting a figure in an application cycle.
We may earn commissions from some links on this page, but this does not affect our reviews or your experience.