


The mean DAT Academic Average was 407.8 across the 17,430 examinations taken between March 1 and December 31, 2025, and the median was 410, according to the ADA DAT User's Manual. That one figure hides a 29-point spread between sections: the average Reading Comprehension score was 427.7 and the average General Chemistry score was 398.8.
Both halves of the number most applicants actually want are published, and neither one appears on the pages that rank for this question. The ADA reports the mean for every reporting area on the 200 to 600 scale. ADEA reports the mean for the students who were admitted.
- The mean Academic Average was 407.8 and the median 410 for March to December 2025 attempts.
- The average is a different number in every reporting area, from 398.8 in General Chemistry to 427.7 in Reading Comprehension.
- First-time, first-year dental school enrollees averaged an Academic Average of 20.9 on the old scale, about 438 on the current one, roughly 30 points above the whole test pool.
- The gap is widest in Total Science, about 44 points, and narrowest in Perceptual Ability, about 29.
- 52.5% of enrollees had an Academic Average of 21 or higher. Only 28.8% of 2025 DAT attempts reached the equivalent score of 440.
The average DAT score, area by area
The DAT reports eight numbers, and each has its own average. The table below gives the mean and the median for every reporting area, from all 2025 attempts scored on the current scale.
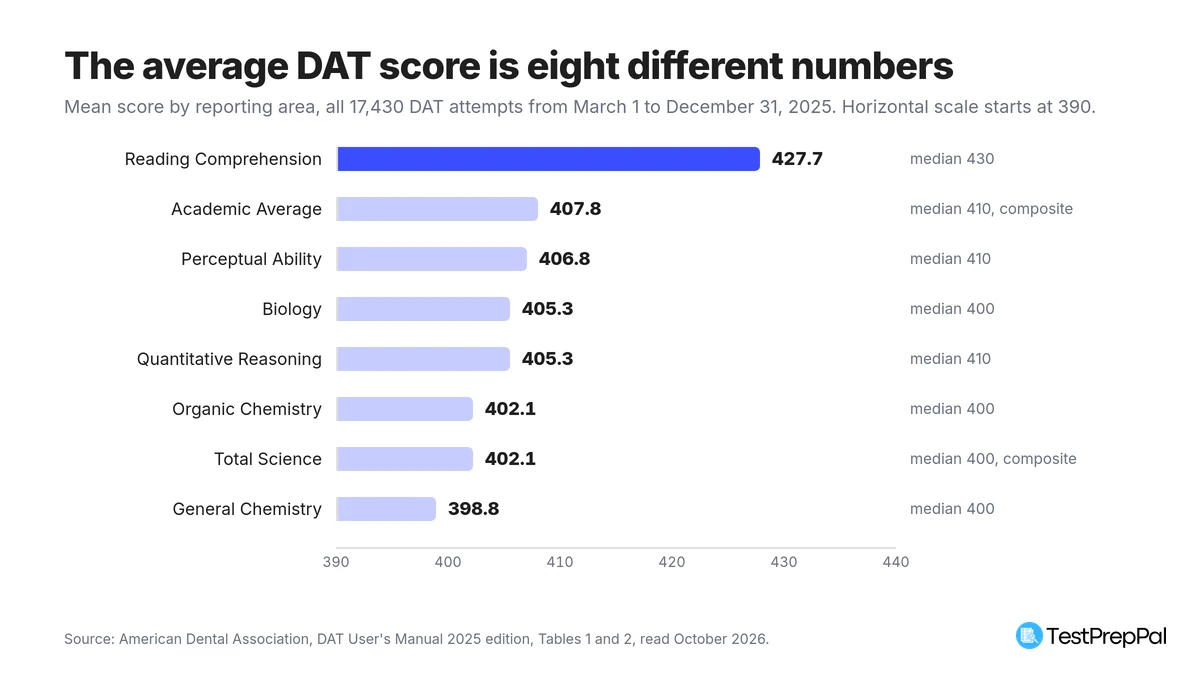 Mean score by reporting area, March 1 to December 31, 2025. Source: ADA DAT User's Manual, Tables 1 and 2.
| Reporting area | Mean | Median | Share at 440 or higher | Old-scale equivalent |
|---|---|---|---|---|
| Reading Comprehension | 427.7 | 430 | 44.6% | about 21.9 |
| Academic Average | 407.8 | 410 | 28.8% | about 18.9 |
| Perceptual Ability | 406.8 | 410 | 32.7% | about 18.8 |
| Biology | 405.3 | 400 | 31.2% | about 18.8 |
| Quantitative Reasoning | 405.3 | 410 | 25.6% | about 18.3 |
| Organic Chemistry | 402.1 | 400 | 28.8% | about 18.2 |
| Total Science | 402.1 | 400 | 28.4% | about 18.2 |
| General Chemistry | 398.8 | 400 | 27.6% | about 17.9 |
Two of those rows are composites rather than sections. The Academic Average is the rounded mean of Quantitative Reasoning, Reading Comprehension, biology, general chemistry and organic chemistry, and Total Science is the rounded mean of the three sciences. Rounding goes to the nearest 10-point step, so a calculated 343 is reported as 340. The DAT scoring guide covers the mechanics; the section breakdown covers what each area tests.
The last column is where most pages go wrong. "A 400 is about an 18" gets repeated everywhere, and for the Academic Average it is close enough: the ADA concordance table puts an old 18 at 390 and an old 19 at 410, so a mean of 407.8 lands at about 18.9. Apply the same shortcut to Reading Comprehension and it breaks. In that area an old 18 is 360 and an old 22 is 430, so the 2025 mean of 427.7 is worth about a 21.9. The conversion is section-specific, which is why our DAT score conversion tool carries a separate column for each area rather than one table for all of them.
What the students who got in actually averaged
The ADA publishes what test takers score. ADEA publishes what admitted students scored, and the two numbers are not close.
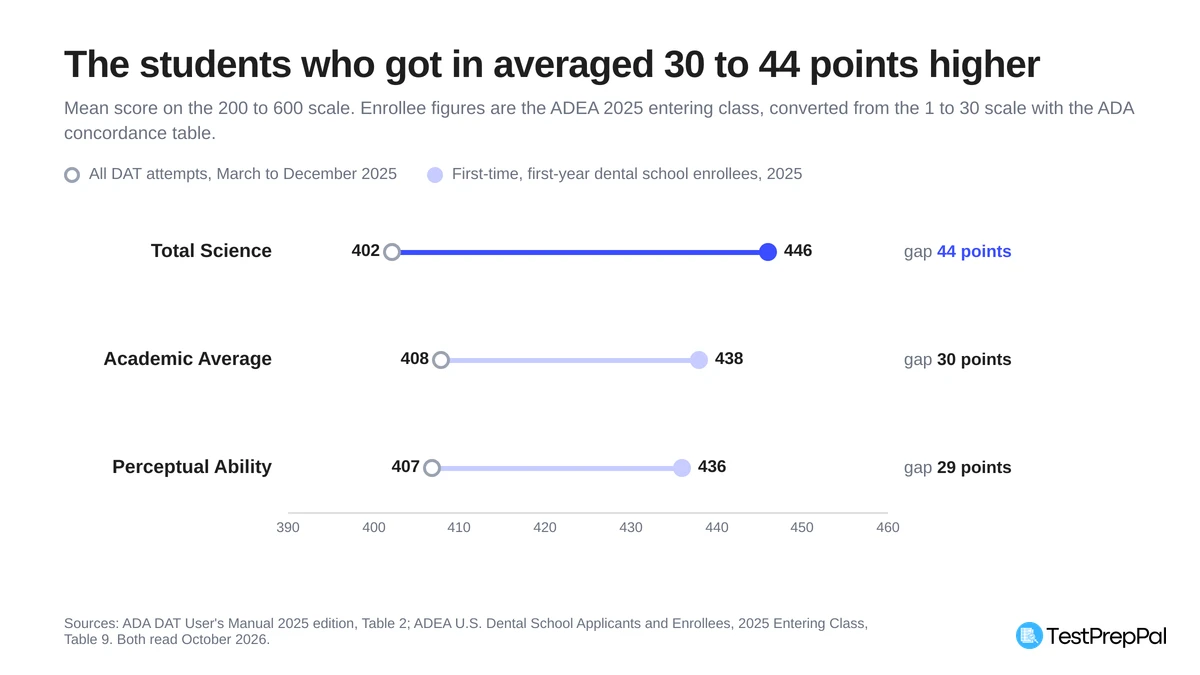 All 2025 DAT attempts against the 2025 first-year enrollee class. Sources: ADA DAT User's Manual and ADEA applicants and enrollees report.
In ADEA's U.S. Dental School Applicants and Enrollees, 2025 Entering Class data report, applicants averaged an Academic Average of 19.6 and first-time, first-year enrollees averaged 20.9. ADEA still reports those on the 1 to 30 scale, because that class applied with scores earned mostly before the scale changed. Run them through the ADA concordance and the comparison becomes direct.
| Reporting area | All 2025 attempts | 2025 applicants | 2025 enrollees | Enrollee gap |
|---|---|---|---|---|
| Academic Average | 407.8 | 19.6 old, about 416 | 20.9 old, about 438 | about 30 points |
| Total Science | 402.1 | 19.4 old, about 418 | 20.8 old, about 446 | about 44 points |
| Perceptual Ability | 406.8 | 19.4 old, about 418 | 20.3 old, about 436 | about 29 points |
The Total Science gap is the one to notice. It is nearly half again the Academic Average gap, and it holds up in either unit: measured on the old scale the three gaps are 2.6, 2.0 and 1.5 points, in the same order. The three sciences separate admitted students from the general test pool more sharply than the headline average does, which is an argument for treating a weak general chemistry score as a bigger problem than its effect on your Academic Average suggests.
The distribution says the same thing more bluntly. ADEA reports that 52.5% of first-time, first-year enrollees had an Academic Average of 21 or higher, against 33.8% of applicants. An old-scale 21 is a 440 today, and only 28.8% of all 2025 DAT attempts reached 440. At the other end, 11.9% of enrollees scored 17 to 18, against 21.3% of applicants.
The median enrolled student sits almost exactly at a score that fewer than three in ten test attempts reach. That is the real answer to "what average do I need", and it is roughly three 10-point steps above the national mean.
Two cautions before you use those numbers against your own score. They describe different people in different windows: the ADA figures are examinations taken from March 2025 onward, while the 2025 entering class applied a year earlier. And the ADA counts examinations rather than candidates, so a repeater appears more than once. To weigh a specific score and GPA against a specific school list, the dental school acceptance calculator uses the ADEA applicant and enrollee benchmarks directly.
Why General Chemistry and Reading Comprehension sit 29 points apart
Scoring the same number in two sections does not mean performing the same. The gap between the highest-scoring and lowest-scoring areas in 2025 was 28.9 points, Reading Comprehension over General Chemistry, and the medians tell it even more plainly: half of all Reading Comprehension scores were 430 or better, while half of all General Chemistry scores were 400 or worse.
So a 430 is three steps above the General Chemistry median and exactly at the Reading Comprehension median. A flat set of 430s is not a flat performance, and admissions readers who know the sections read it that way.
One thing to flag if you are checking your own percentile. The ADA's percentile table is built on a separate normative sample, and the two documents disagree most in Reading Comprehension: the normative sample puts a 430 there at the 74th percentile, while the 2025 cohort's median was 430. The percentile calculator uses the ADA's published table, and what is a good DAT score explains why the two samples give different answers for the same number.
The average is lower if you are retaking
The User's Manual splits every area by first-time takers and repeaters, and the split is consistent.
| Reporting area | First-time takers | Repeaters | Gap |
|---|---|---|---|
| Reading Comprehension | 432.5 | 418.5 | 14.0 |
| Academic Average | 413.9 | 396.3 | 17.6 |
| Biology | 411.4 | 393.6 | 17.8 |
| Quantitative Reasoning | 411.1 | 394.3 | 16.8 |
| Perceptual Ability | 410.7 | 399.4 | 11.3 |
| Organic Chemistry | 409.6 | 387.8 | 21.8 |
| Total Science | 408.7 | 389.5 | 19.2 |
| General Chemistry | 404.9 | 387.0 | 17.9 |
Organic chemistry separates the two groups by nearly twice what Perceptual Ability does. Read the table for what it is, though: these are group means for two different sets of people, not the same candidates measured twice. The ADA does not publish score changes across attempts for individual candidates, so the gap tells you who retakes, which is mostly people whose first score was low. It does not tell you what a retake would do for you. If one science section is the problem, a DAT prep course aimed at that section is a more specific fix than a second general pass, and the DAT hub has the rest of the planning material.
Average DAT score FAQs
What is the average DAT score?
The mean Academic Average was 407.8 and the median was 410, across 17,430 DAT examinations taken between March 1 and December 31, 2025. Section averages run from 398.8 in General Chemistry to 427.7 in Reading Comprehension. On the old 1 to 30 scale those figures correspond to roughly an 18.9 Academic Average.
Is a 400 a bad DAT score?
No, a 400 Academic Average is just below the national mean of 407.8. Some 61.2% of 2025 attempts were at or above 400, so it sits a little under the middle of the field rather than at the bottom. Whether it is enough depends on your school list, since enrolled students averaged closer to 438.
Is 17 a bad DAT score?
An old-scale 17 Academic Average converts to 370 on the current scale, and about 25% of 2025 attempts were at or below that. It is a below-average score. For context, 11.9% of the students who enrolled in dental school in 2025 had an Academic Average of 17 or 18, so it is not disqualifying on its own.
Is a 23 on the DAT good?
Yes. An old-scale 23 Academic Average is 470 today, and only 12.7% of 2025 attempts reached 470 or higher. That is comfortably above the enrollee average of about 438 for the 2025 entering class.
What is the average DAT score for students accepted to dental school?
First-time, first-year enrollees in the 2025 entering class averaged an Academic Average of 20.9 on the 1 to 30 scale, which the ADA concordance puts at about 438 on the 200 to 600 scale. Their Total Science average was 20.8, about 446, and their Perceptual Ability average was 20.3, about 436. Applicants to the same class averaged 19.6, or about 416.
We may earn commissions from some links on this page, but this does not affect our reviews or your experience.