


The average GMAT score is 554.94 on the 205 to 805 scale the exam uses today, which GMAC's official score table places at the 47th percentile. The number that trips people up comes next: Harvard reports both a 685 and a 730 for the same incoming class, because one of those is on today's scale and the other is on the retired 800-point scale.
That is the whole problem with this question. The global average is quoted on the current scale, and most school averages you will find are quoted on the old one. Subtract one from the other and you get a gap that is about 45 points too wide.
- The global average total score is 554.94, which sits at the 47th percentile.
- Top MBA class averages run from 645 at London Business School to 687 at Kellogg, all on the current scale.
- Harvard publishes a 685 median and a 730 median for its Class of 2027. Those 45 points are a change of scale, not a difference in students.
- Current scores end in 5 and run 205 to 805. Retired scores end in 0 and run 200 to 800.
- The real distance from the global average to a top MBA class is about 130 points, not the 175 you get by mixing scales.

Target Test Prep GMAT
One of the most complete GMAT prep platforms we've reviewed. Try full access for 5 days.
No code neededPros
- Very large GMAT content and practice library
- Strong analytics, error tracking, and custom test tooling
- 130-point score improvement guarantee
Cons
- Higher tiers become expensive quickly
What is the average GMAT score right now
GMAC reports a total score from 205 to 805, built from Quantitative Reasoning, Verbal Reasoning and Data Insights, with the three sections weighted equally. The mean total score is 554.94, drawn from 509,182 tests over a data period of 2021 to 2026, with a standard deviation of 94.24.
Here is where that average falls on GMAC's published percentile table.
| Total score | Percentile ranking |
|---|---|
| 705 | 98% |
| 655 | 90% |
| 605 | 69% |
| 555 | 47% |
| 505 | 27% |
| 455 | 16% |
A 555 is the 47th percentile, so the average score sits just below the middle of the field. Slightly more than half of all test takers score above the average, which is what you would expect from a distribution with a long tail at the bottom. If you want the percentile for your own number rather than these summary rows, our GMAT percentile calculator handles the in-between scores.
The 94.24 standard deviation is worth holding on to. One standard deviation above the mean lands near 649, between the 645 and 655 score steps, and that single step carries you from the 47th percentile to the 87th or 90th. The curve is steep in the middle, which is also why small gains near the average move your ranking more than large gains near the top. We go into that in more detail in how hard the GMAT actually is.
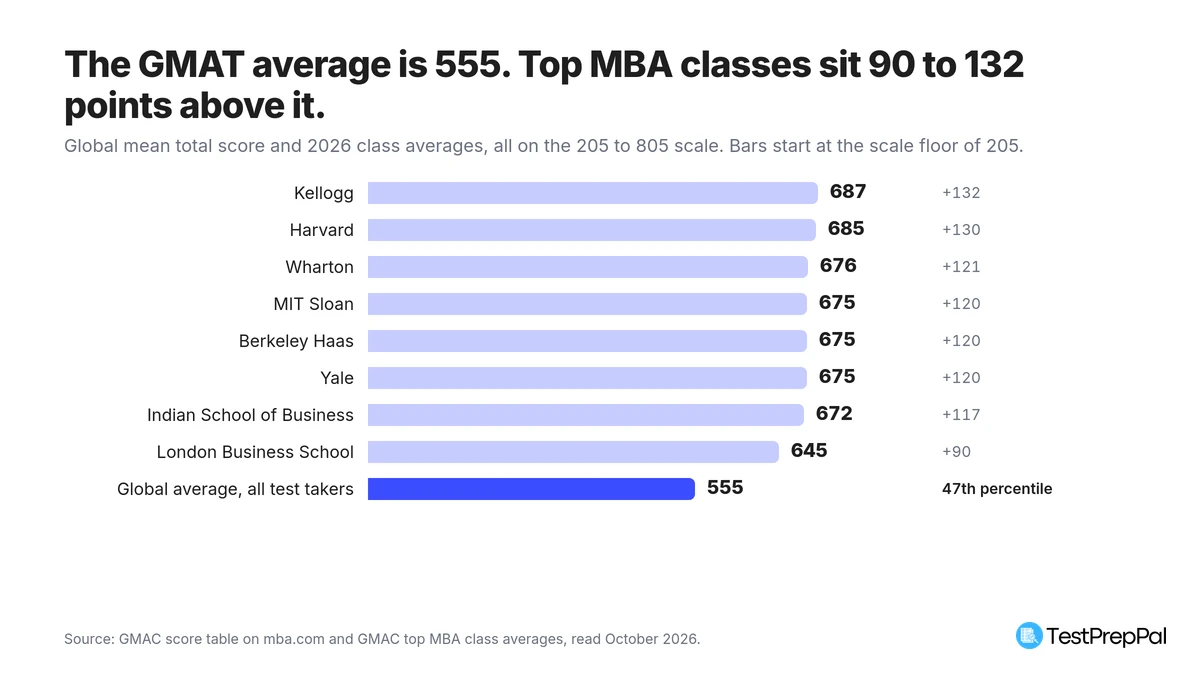 The global average and top MBA class averages, all on the current 205 to 805 scale. Sources: GMAC score table and GMAC class average figures, read October 2026.
Why the average looks nothing like a business school average
The global mean covers everyone who sat the exam, including first attempts, practice-minded retakes and candidates who never apply anywhere. A school average covers admitted students only, at schools that reject most applicants. The two numbers are measuring different populations, so the gap between them is not a measure of how far you have to climb.
GMAC's 2026 figures for the world's top programs are all on the current scale.
| School | Class average, current scale |
|---|---|
| Kellogg | 687 (median) |
| Harvard | 685 |
| Wharton | 676 |
| MIT Sloan | 675 |
| Berkeley Haas | 675 |
| Yale | 675 |
| Indian School of Business | 672 |
| London Business School | 645 |
| HEC Paris | 635 |
| Cambridge Judge | 630 |
| Esade | 615 |
Kellogg's 687 is the highest average of any MBA class in the world, and every US school on GMAC's list averages 670 or higher. The Indian School of Business at 672 is the highest outside the US, and London Business School at 645 is the highest in Europe. INSEAD does not publish an average at all, though GMAC notes estimates placing it around 655. Duke Fuqua and Cornell Johnson did not release figures for this cycle.
Two things about that table are easy to miss. First, none of 687, 676 or 672 is a score anyone can actually earn. Total scores move in 10-point steps and always end in 5, so these are class averages sitting between real scores. The nearest scores either side of Kellogg's 687 are 685 and 695.
Second, the spread across the entire global top is narrower than it looks. Kellogg's 687 down to London Business School's 645 is 42 points, and at that height of the curve 42 points is worth about 3 percentile points: GMAC puts 645 at the 87th percentile and 655 at the 90th. The difference between the most selective class in the world and a top European class is small enough that it should not drive your school list on its own.
Admitted ranges are wider still. Kellogg accepted students from 515 to 775. London Business School had an admit at 805 and at least one at 555, which is below the global average. An average is the centre of a class, not a cutoff.
Sponsored
Target Test Prep GMAT
One of the most complete GMAT prep platforms we've reviewed. Try full access for 5 days.
No code neededPros
- Very large GMAT content and practice library
- Strong analytics, error tracking, and custom test tooling
- 130-point score improvement guarantee
Cons
- Higher tiers become expensive quickly
The same class, two numbers: Harvard's 685 and 730
Harvard's MBA class profile is the clearest demonstration of the scale problem anywhere, because the school publishes both versions side by side for one group of students.
For the Class of 2027, Harvard reports a GMAT median total of 685 with a middle 80 percent range of 645 to 735. In a separate block on the same page, it reports a GMAT 10th Edition median total of 730 with a middle 80 percent range of 690 to 770. Same class, same students, two numbers 45 points apart.
Harvard publishes both because its class submitted both. For the Class of 2027, 44 percent submitted the GRE, 34 percent submitted the GMAT and 28 percent submitted the GMAT 10th Edition, with some students submitting more than one test. The old exam's scores stay valid for up to five years, so for the next few admissions cycles schools will keep reporting two GMAT medians.
Measure your Focus score against Harvard's 685 and the gap is 130 points. Measure it against Harvard's 730 and the gap looks like 175 points. Those extra 45 points are the scale changing underneath you, and nothing else.
The ranges drift too. Harvard's current-scale middle 80 percent spans 90 points, from 645 to 735. The same class on the old scale spans 80 points, from 690 to 770. A range on one scale cannot be read against a score on the other, which is why GMAC tells you to compare percentile rankings rather than totals.
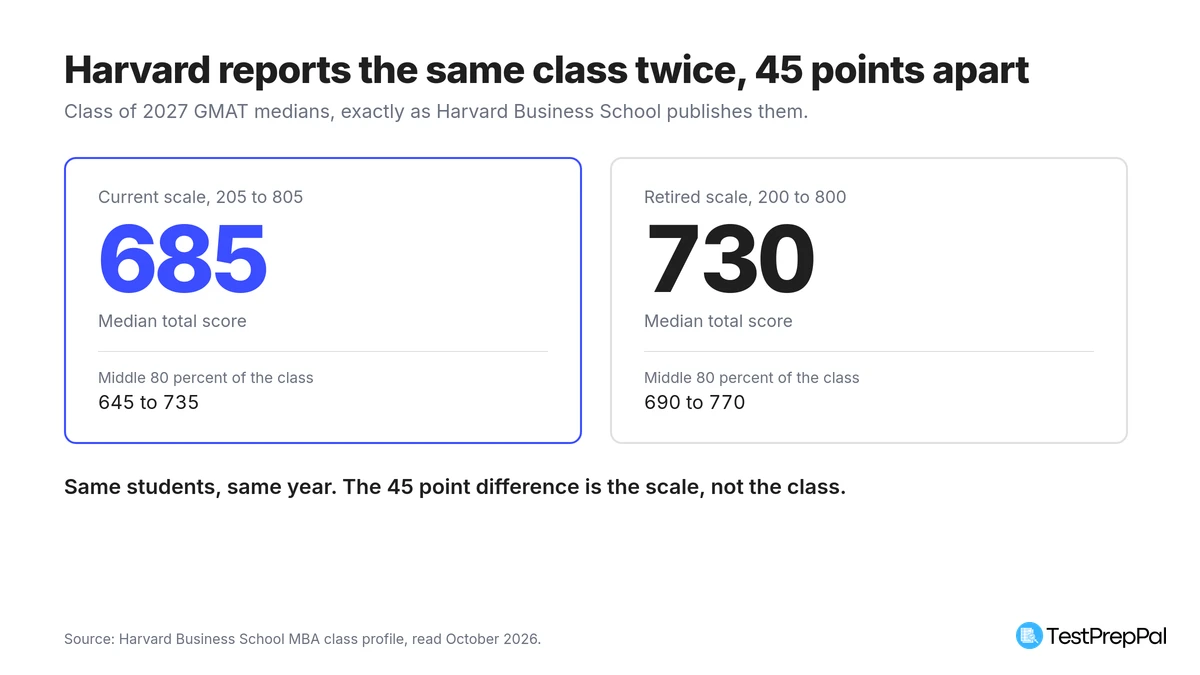 One Harvard class, reported twice. Source: Harvard Business School class profile, read October 2026.
Worth noting alongside those numbers: Harvard states there is no minimum GMAT or GRE to apply and no preference between the two tests. With 44 percent of the class submitting the GRE, the choice of exam is genuinely open, and we compare the two in GMAT vs GRE.
How to tell which scale a number is on
The rule is mechanical. Current total scores run 205 to 805 in 10-point steps, so every valid current score ends in 5. Retired scores ran 200 to 800 in the same steps, so every valid retired score ends in 0. A 730 or a 700 is always an old number. A 685 or a 645 is always a current one. Class averages are the exception, because an average of many scores can land anywhere.
GMAC is blunt about what follows from that. Comparing total scores across the two editions is "not appropriate, accurate, or a meaningful comparison of performance", and the right move is to compare percentile rankings instead. GMAC applies that caution to its own work: the old-format column in its school article carries a footnote saying those ranges are "based on relative competitiveness and are not a direct conversion". Even the exam's owner declines to convert school averages directly. To put your own score on the other scale, use our GMAT score conversion tool, which runs GMAC's concordance.
This is where the pages ranking for this question go wrong. ClearAdmit's table of average GMAT scores at top US programs lists the Class of 2027 almost entirely on the retired scale, including a 730 median for Harvard, but four rows are current-scale scores marked only with a triple asterisk. Indiana Kelley appears as a 607 in the same column as Columbia's 734. Read that column without checking the footnotes and Kelley looks like a collapse, when the two numbers are simply on different scales.
The errors run the other way as well. College Ave's guide to the average GMAT score states that the global mean "has steadily climbed from 565 in 2019 to roughly 585 in 2024". GMAC's live table gives a mean of 554.94 for a 2021 to 2026 data period, and publishes no series supporting a climb to 585. Where a secondary page and GMAC disagree, take GMAC's number.
If your goal is to set a target rather than read the landscape, what counts as a good GMAT score prices every band against the same official table, and the GMAT prep course reviews cover what it takes to move between them. The GMAT hub collects the rest.
Average GMAT score FAQs
What is the average GMAT score for top MBA programs?
On the current scale, GMAC's 2026 figures run from 645 at London Business School to 687 at Kellogg. Harvard is 685, Wharton 676, and MIT Sloan, Berkeley Haas and Yale all sit at 675. Every US school on GMAC's list averages 670 or higher, which is at least 115 points above the global average of 554.94.
Is a 645 GMAT score good?
GMAC places 645 at the 87th percentile as of 2026, meaning you outscored roughly 87 percent of test takers. It is also London Business School's class average and the bottom of Harvard's middle 80 percent range. Whether it is enough depends on your school list rather than on the percentile alone.
Why is the global average so much lower than every school average?
They count different people. The 554.94 mean covers all 509,182 tests in GMAC's current data period, including everyone who sat the exam and never applied to a program. School averages cover admitted students at schools that reject most applicants, so they sit far above the middle of the overall distribution by construction.
What is the average GMAT score on the old 800 scale?
There is no current official figure to quote, because GMAC publishes the mean only for the exam it administers now. Converting 554.94 yourself is not reliable either, since GMAC warns that cross-edition total scores are not comparable. If you hold an old score and want to know where it sits today, run it through the score conversion tool rather than adjusting the average.
We may earn commissions from some links on this page, but this does not affect our reviews or your experience.