


The average LSAT score is 153. Running the arithmetic across LSAC's current score distribution gives a mean of 152.96 and a median of 153, which is one to two points higher than the 151 that most pages and AI answers still quote.
The bigger problem with the question is that it hides two different averages. What all test takers score and what admitted students score are separate numbers roughly 14 to 20 points apart, and almost every answer online quietly swaps one for the other.
- Across LSAC's 2023-2026 testing years, the mean LSAT score works out to 152.96 and the median to 153.
- A 151 is not average. Only 39.81 percent of scores fall below it, so it sits well under the midpoint.
- The "average admitted student" is a different figure, and no organization publishes a national one.
- Each law school reports its own median in its ABA Standard 509 report, and those medians differ widely from school to school.
- Clearing a median of 167 puts you in the top 10.5 percent of all scores. Clearing 173 puts you in the top 2.4 percent.
- LSAC rebuilds the percentile table every July, so the percentile attached to your score moves even when your score does not.
The average LSAT score is 153
LSAC's LSAT Percentiles table, read on October 9, 2026, is the only complete picture of what test takers actually score. It covers the 2023-2024, 2024-2025 and 2025-2026 testing years and gives, for each of the 61 scores on the scale, the percentage of test scores below it.
LSAC does not print an average on that page. It does not have to: the table is a full cumulative distribution, so the average is already in there. The share of scores at exactly 153, for instance, is the percentage below 154 minus the percentage below 153, or 50.43 minus 46.93, which is 3.50 percent. Do that for all 61 scores and the shares total exactly 100 percent, which is the check that the method is sound. Weight each score by its share and you get the mean.
Our calculation on LSAC's published figures returns:
| Measure | Value | How it is derived |
|---|---|---|
| Mean score | 152.96 | Each score weighted by its share of the distribution |
| Median score | 153 | The score band containing the 50th percentile |
| First score above the midpoint | 154 | 50.43 percent of scores fall below it |
The median takes one extra step. Scores of exactly 153 occupy the stretch of the distribution from 46.93 percent to 50.43 percent, and the halfway mark falls inside that stretch, so 153 is the median score. A 154 is the first score with at least half the field beneath it.
Mean and median landing on the same number is unusual and worth noticing. It tells you the distribution is close to symmetric: there is no long tail of very high or very low scores dragging the average away from the middle. That is by design, since the raw-to-scaled conversion exists to make scores comparable across administrations.
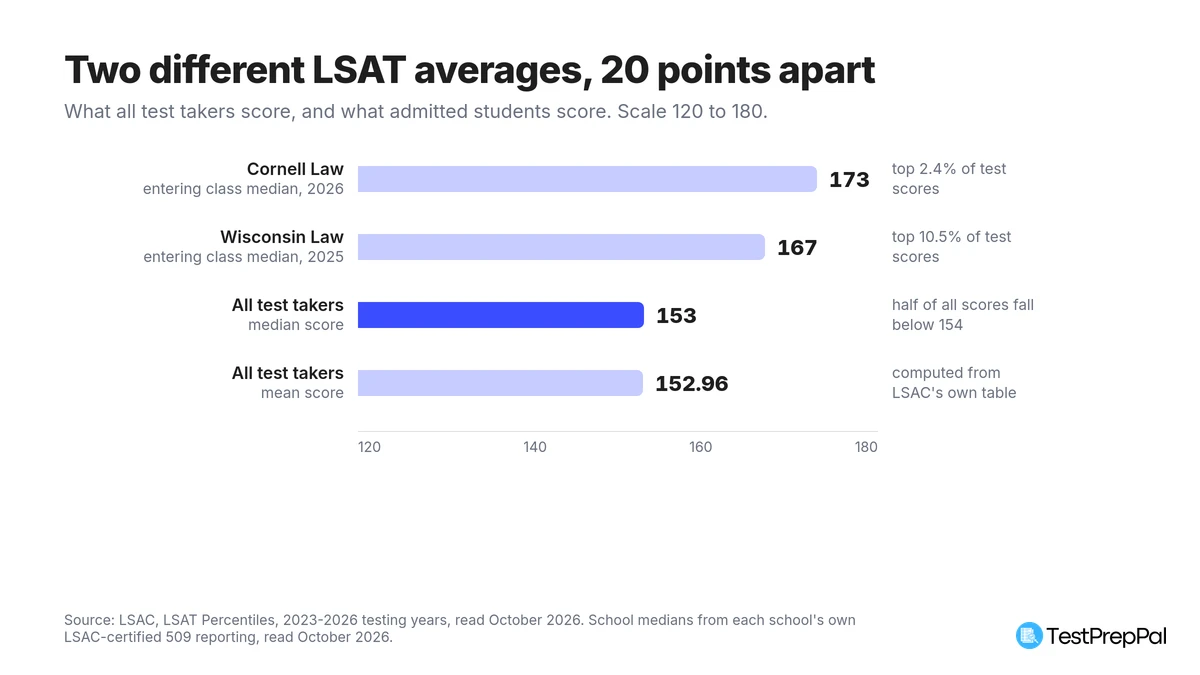 The test-taker average and the admitted-student median are separate numbers. Sources: LSAC percentile table and each school's own 509 reporting, read October 2026.
The mechanics behind the scale are straightforward. LSAC's LSAT Scoring page confirms that your raw score is simply the number of questions you answered correctly, that every question carries the same weight, and that there is no deduction for a wrong answer. That raw score converts to the 120 to 180 scale that appears on your report. Our LSAT score range explainer walks through what each band of that scale takes.
One detail in the table rewards a careful reader. LSAC's scoring page describes your percentile as the percentage of test takers who scored lower than you, while the percentile table itself describes the percentage of test scores that are lower. Those are not the same population. A candidate who sits the test three times contributes three scores, so the distribution is a distribution of scores, not of people. It is the right basis for comparing your own score, which is also one score among many.
Why the number you keep seeing is 151
Search for this question and you will be told the average is roughly 151 to 152. That figure is stale, and it is easy to show why.
On LSAC's current table, 151 has 39.81 percent of scores below it. A score at the 40th percentile is not an average by any definition. The midpoint of the current distribution is two points higher.
The percentile bands that travel with that claim are further off. A widely repeated version labels 151 to 159 as the 50th to 78th percentile and 170 and above as the 97th percentile and up. LSAC's own table disagrees at every point:
| Score | Commonly quoted percentile | LSAC's current figure |
|---|---|---|
| 151 | 50th | 39.81st |
| 159 | 78th | 67.93rd |
| 170 | 97th | 94.48th |
The gap at the top end matters most, because that is where small differences change school lists. A 170 is the 94.48th percentile today. The first score with 97 percent of the field below it is 173, three points higher. If you have been planning around a 170 as a 97th-percentile result, you have been working from a chart that no longer matches what schools are reading. Our LSAT score percentiles page carries the current table in full.
Stale numbers persist here for a structural reason. LSAC rebuilds the percentile table every year by the end of July from the previous three testing years, and most pages quoting an average never went back to recompute it.
The other average: what admitted students score
Here is the part that the single-number answers get wrong, and it is not a rounding issue.
There is no national average LSAT score for admitted law students. Nobody publishes one. The ABA's 2025 Standard 509 Data Overview, posted in December 2025, is the official national summary of what the 196 Council-approved law schools reported. It records 42,817 first-year enrollees, broken out by race, ethnicity and gender, and it contains no LSAT median, mean or distribution anywhere in it. LSAC does not publish one either.
What exists instead is each school's own number. Every ABA-approved school must post a Standard 509 Information Report each year giving the 25th percentile, median and 75th percentile LSAT of its entering class, and the ABA hosts both the individual reports and aggregate spreadsheets on its legal education statistics pages.
Two real examples show how far those sit from the test-taker average. Cornell Law School reports a median LSAT of 173 for the class that entered in 2026, with a 25th to 75th percentile range of 167 to 175 and a 14 percent acceptance rate. The University of Wisconsin Law School, whose LSAT and GPA figures are certified by LSAC, reports a median of 167 for its 2025 entering class, up from 165 in both 2024 and 2023, with a 25th to 75th range of 161 to 169.
Cornell's median is 20 points above the test-taker median of 153. Wisconsin's is 14 points above it.
Translate those into the share of test takers who clear them and the distance becomes concrete:
| Score | Percent of scores below | Share of scores at or above |
|---|---|---|
| 153 (all test takers, median) | 46.93% | 53.07% |
| 161 (Wisconsin 25th percentile) | 74.22% | 25.78% |
| 165 (Wisconsin median, 2023 and 2024) | 85.17% | 14.83% |
| 167 (Wisconsin median, 2025) | 89.53% | 10.47% |
| 173 (Cornell median, 2026) | 97.59% | 2.41% |
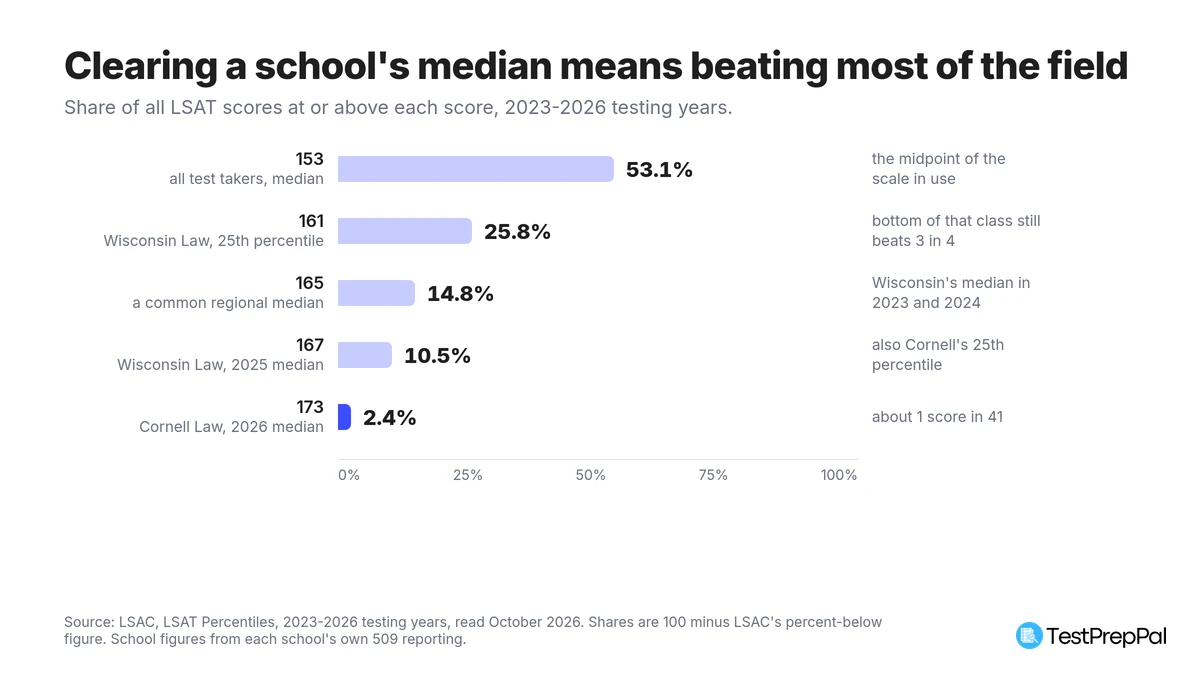 Share of all LSAT scores at or above each score, 2023-2026 testing years. Calculated as 100 minus LSAC's percent-below figure.
Read the Wisconsin row carefully. A student at the 25th percentile of that entering class, the bottom quarter, still scored higher than roughly three quarters of everyone who took the test. That is the gap between the two averages in one line.
Wisconsin's three-year run is also a reminder that a school median is a moving target. It held at 165 for two cycles and then rose two points, while the national test-taker distribution behind it barely shifted. School medians respond to application volume and class size, not just to how the testing population performs.
Which average you should actually use
If you are asking how you did, compare yourself to 153 and the percentile table. If you are asking whether you can get in, ignore the national average entirely and compare yourself to the published medians of the specific schools on your list.
The test-taker average tells you one thing only: where you landed in the field. It is useful for deciding whether a retake is realistic, because moving from the 40th to the 70th percentile is a well-trodden path while moving from the 94th to the 98th is not.
The admitted-student numbers do the actual work of building a school list. Because each school publishes its own 25th, median and 75th, you can place yourself precisely: above the 75th and you are a strong candidate for a scholarship, at the median and you are competitive, below the 25th and the rest of your application has to carry you. Our guide to what counts as a good LSAT score works through that logic school by school, and the highest LSAT score breakdown covers how thin the air gets at the top of the scale.
Two other numbers sit alongside your LSAT in that comparison. Schools read your score next to the GPA that LSAC recalculates rather than the one on your transcript, so run yours through our LSAC CAS GPA calculator before you judge your position. And if you are weighing a GRE score against an LSAT score, our score converter puts them on the same footing.
If the gap between your score and your target median is real, close it before you apply rather than after. Sizing that gap in weeks is the next step, and our guide to how long it takes to get there turns it into a start date against the current LSAC calendar. The LSAT hub collects our prep guidance, our LSAT prep course reviews cover the paid options and what each actually includes, and our free LSAT resources page lists what you can use without spending anything.
Average LSAT score FAQs
Is 151 a good LSAT score?
It is below average. On LSAC's current table, 39.81 percent of scores fall below 151, which puts it at roughly the 40th percentile and two points under the 153 median. Whether it works for you depends entirely on your school list, so check the published 509 median for each school you are considering before deciding anything.
Is 159 a good LSAT score?
A 159 is the 67.93rd percentile, so it beats about two thirds of all scores. Whether it is good depends entirely on where you are applying. At Cornell, for example, it falls below the 25th percentile of 167, so the bottom quarter of that entering class still scored eight points higher.
What is the average LSAT score for students admitted to law school?
No organization publishes a national figure. The ABA's own 2025 national 509 summary reports enrollment for all 196 approved schools and no LSAT data at all. What you can get is each school's median, which every ABA-approved school is required to publish annually and which varies widely between them. Cornell's is 173 and Wisconsin's is 167, against a test-taker median of 153.
Has the average LSAT score gone up?
The scale itself is fixed and the distribution is stable, so the honest answer is that the average has not moved much. What does move is the percentile attached to a given score, because LSAC rebuilds the table every July from the most recent three testing years. School medians move faster: Wisconsin's rose two points between its 2024 and 2025 entering classes while the underlying test-taker distribution stayed put.
We may earn commissions from some links on this page, but this does not affect our reviews or your experience.